The Kp index is useful when deciding whether to watch for aurora, but it is easy to read too much into one number. Treat it as a description or forecast of geomagnetic activity across Earth, then investigate what that means for your location and observing window. A high value is a reason to check conditions, not a reservation for a northern lights display.
What Kp measures
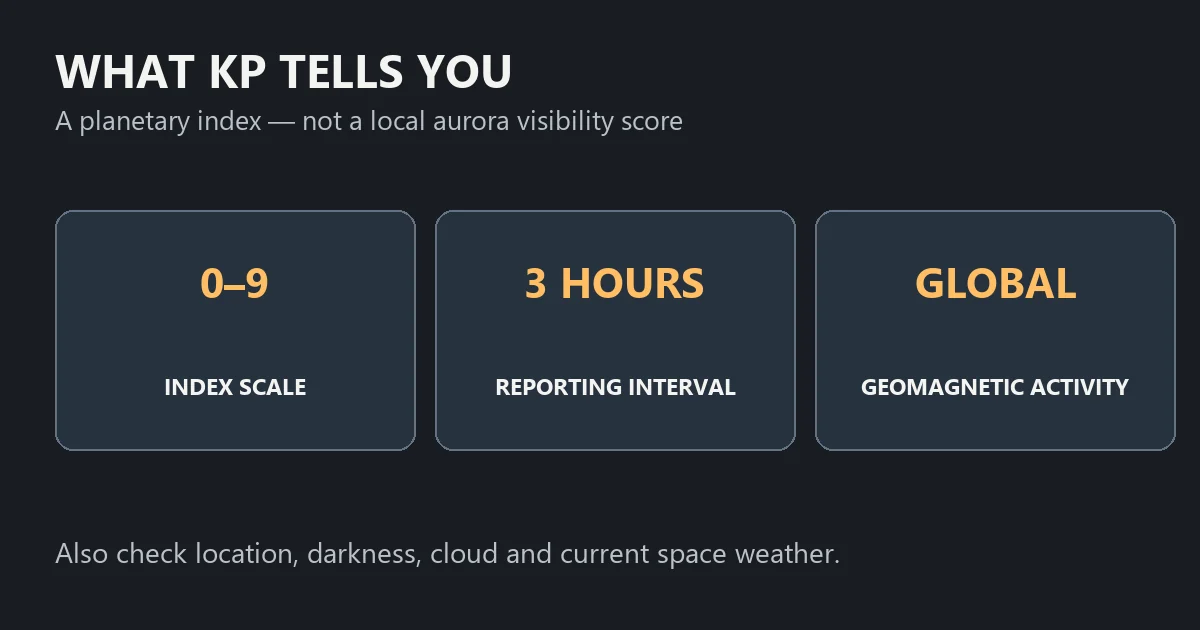
Kp summarizes disturbances in Earth’s magnetic field on a scale from 0 to 9. The planetary index combines standardized measurements from geomagnetic observatories over three-hour intervals. NOAA’s operational values are estimates. This measures magnetic activity; it is not a percentage chance of seeing aurora from your backyard. See NOAA’s Planetary K-index explanation.
NOAA uses Kp in its geomagnetic storm scale: Kp 5 corresponds to G1, or a minor storm, and larger values correspond to higher storm levels. The storm label describes space-weather conditions rather than the quality of a particular observer’s photographs. Keep the number and its timestamp together when saving or sharing a forecast.
Distinguish a forecast from an observation
An observed or estimated Kp value describes measured activity for an interval. A forecast describes expected future activity and can change. Before using a chart, read its label, interval and time zone. A dramatic value from yesterday is not a forecast for tonight, and a future peak outside your available hours may not help your session.
Try writing a planning note in this form: source, update time, forecast interval, local observing hours. This simple habit makes it easier to compare a later update with the same interval instead of mistaking a new chart for an increase or decrease in activity.
Why the same Kp does not give everyone the same view
NOAA describes the relationship between Kp and auroral latitude as approximate. Greater activity generally extends the auroral oval toward lower geomagnetic latitudes, but geomagnetic latitude is different from ordinary geographic latitude. Observers near the oval can see useful displays at relatively low Kp. Darkness, location and the view toward the aurora also matter. See NOAA’s aurora viewing guidance.
Do not turn an approximate latitude diagram into a personal guarantee. Two people following the same global chart can have different clouds, nearby lighting and blocked horizons. For the practical location and weather checklist, read how to see the northern lights.
Use the auroral map alongside Kp
NOAA’s short-term aurora forecast shows modeled location and intensity, with a typical lead time of 30 to 90 minutes. It complements the broader activity index by showing where the aurora is expected. The map is still a forecast, and aurora can be viewed from outside the area directly beneath it when conditions permit.
Compare the map with your location shortly before an outing, then check local clouds and darkness separately. A favorable space-weather picture cannot establish that your observing spot has a clear sky.
A sensible decision sequence
- Check whether the Kp value is observed or forecast and read its timestamp.
- Compare the forecast interval with your actual available hours.
- Review the short-term aurora map as the session approaches.
- Check clouds, horizon obstructions, access and the return journey.
- Choose a reachable location and keep a backup plan if conditions change.
Explore Light Pollution Map for dark-sky planning and aurora information. Use its tools alongside current official forecasts, rather than treating any single index as the final answer to whether you will see northern lights tonight.